Articles and Updates
July 2025
Understanding the ‘Rule of 16’ in Plain Terms
There’s been a lot of chatter about the ‘Rule of 16’ lately, especially during these turbulent market times. While the math behind it is fairly basic, the idea itself deserves a closer look. On the surface, this rule is a quick way to estimate the average daily expected movement for the underlying during the life of an option contract. It's a simplified version of a more technical annualized volatility metric known as standard deviation.
In finance, traders use this same idea to track how much a stock’s price has moved around in the past (known as historical volatility) or is expected to move around in the future (known as implied volatility).
In general terms, IV is calculated by working an option formula backward starting with the current option price, and all other inputs (underlying stock price, time to expiration, dividends, interest rates) remaining the same. Since option prices and IV influence each other, when one moves, the other usually does too.
By using this shortcut, traders can quickly compare historical and implied volatility’s expected average move to help determine if the options market is suggesting an increase or decrease in stock price volatility moving forward.
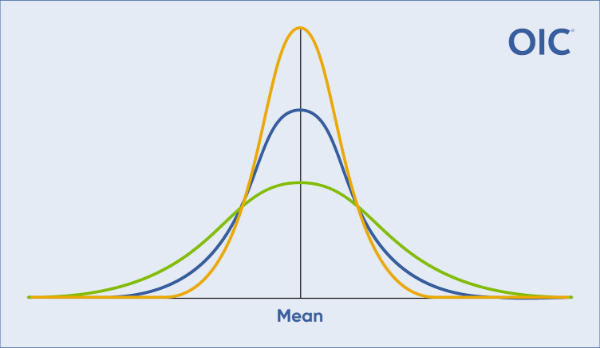
So, What Is Standard Deviation—In Simple Words?
In statistics, standard deviation calculates how much variation there is in a set of numbers. If most of the numbers are close to the average, the standard deviation is low. If they’re all over the place, it’s high. On a graph, this spread usually forms a bell-shaped curve, where most numbers fall close to the middle.In finance, traders use this same idea to track how much a stock’s price has moved around in the past (known as historical volatility) or is expected to move around in the future (known as implied volatility).
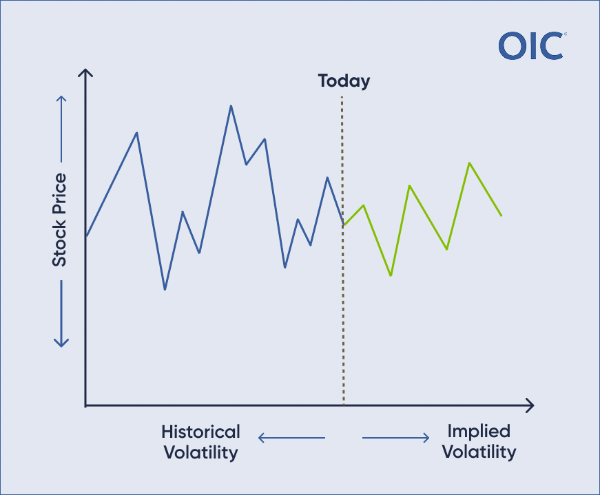
Breaking Down Historical and Implied Volatility
- Historical Volatility (HV) is past-looking. It studies previous price changes and movements of an underlying asset to analyze future price movement in that asset. To calculate HV, traders often use day-to-day closing price’ differences averaged over a given time period.
- Implied Volatility (IV) is forward-looking. It shows how much the market thinks the stock might move in the future and is calculated using options prices. It does not predicate price direction—just the scale of the move over a given amount of time.
In general terms, IV is calculated by working an option formula backward starting with the current option price, and all other inputs (underlying stock price, time to expiration, dividends, interest rates) remaining the same. Since option prices and IV influence each other, when one moves, the other usually does too.
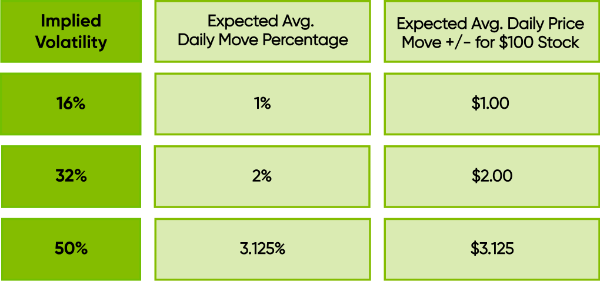
The Root of the ‘Rule of 16’
The Rule of 16 is a comprehensive approach that rounds up the actual square root of 252 trading days, or 15.87, to 16. This makes it faster and easier to calculate the expected move without losing much accuracy.By using this shortcut, traders can quickly compare historical and implied volatility’s expected average move to help determine if the options market is suggesting an increase or decrease in stock price volatility moving forward.
Key Takeaways
- When implied volatility significantly exceeds (or falls well below) historical volatility, investors can then determine whether the implied level is justified or will gravitate toward the historic level.
- The Rule of 16 can be a helpful shortcut, not a magic formula. It does not predict each daily move but instead estimates expected average daily move.