Articles and Updates
October 2023
Volatility Skew and Options: An Overview
The concept of volatility skew is not new to options, but it arguably became more pronounced and evident following Black Monday on Oct. 19, 1987, when the Dow Jones Industrial Average lost more than 22% in one trading session.
But what exactly is skew? Skew is the difference between the implied volatility levels of out-of-the-money (OTM), at-the-money (ATM) and in-the-money (ITM) options. Specifically, it measures the implied volatility level for each option strike price with the same expiration month, and the resultant line drawn among these points is referred to as the "skew curve" or "volatility surface."
When mapping implied volatility levels, the curve these points create is typically identified as either a "smile" or a "smirk" depending on the shape created by the level for out-of-the-money puts and calls. The smile volatility curve exists when both the OTM puts and OTM calls are elevated relative to the ATM implied volatility level. In contrast, the smirk volatility curve shows the disparity between demand for OTM puts and OTM calls, where one side of the distribution exhibits elevated implied volatility levels relative to the rest of the implied volatility curve.
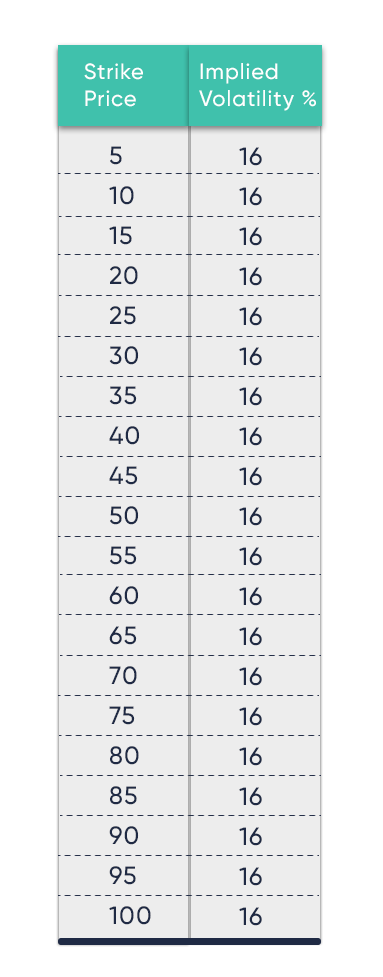
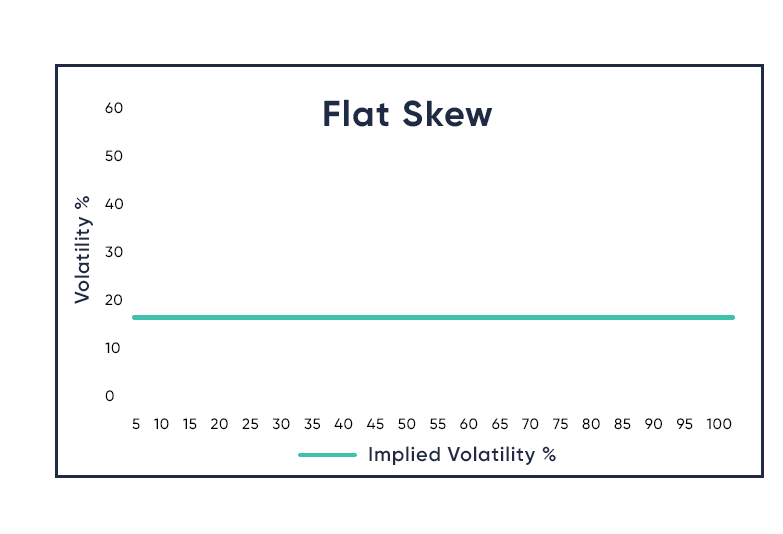
To illustrate these two concepts, let's start with the hypothetical "flat" skew, where all strikes have the same implied volatility. The "flat" skew suggests that forecasted implied volatility levels of options will have little to no difference regardless of direction or severity of movement in the underlying.
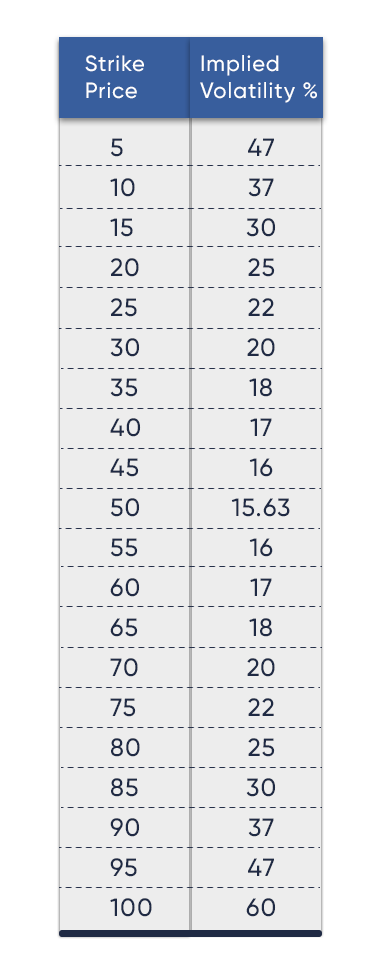
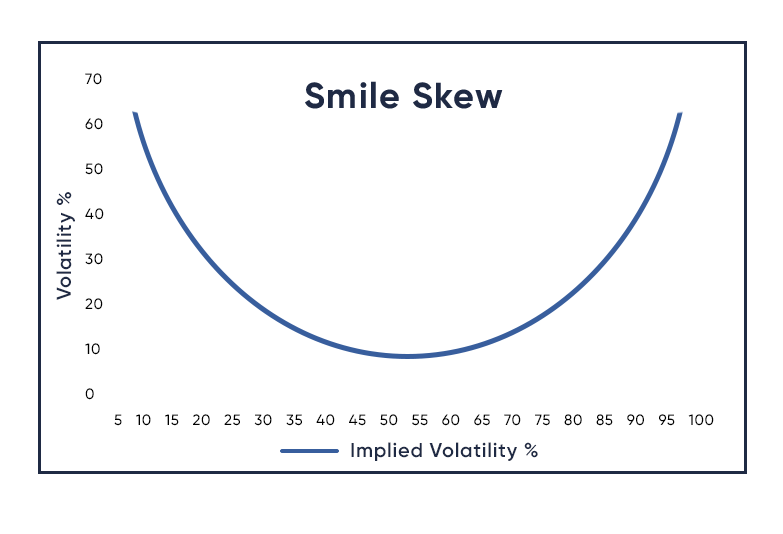
A smile volatility skew generally exists in options when perceived underlying price movement in either direction is forecasted to increase the at-the-money implied volatility level.
Using options in this way may control downside losses and simultaneously limit upside potential. However, doing so in a "smirk" skew environment would imply that the collar investor would likely be purchasing an option with a higher implied volatility level than the option they are selling.
On the other hand, the risk reversal strategy, which consists of simultaneously purchasing an OTM call option and selling an OTM put option with the same expiration, takes advantage of smirk skew by purchasing the lower volatility call and selling the higher volatility put.
The axiom that put options are always more expensive than call options is only true when comparing OTM puts with OTM calls in a "smirk" skew environment. Keep in mind that skew is a function of supply and demand, and can be quite dynamic - meaning these pricing conventions are often subject to change based on market conditions and expectations.
To summarize, skew is a longstanding feature of options, and it can vary depending on the asset class and other factors impacting the underlying markets. For investors, having a basic understanding of how implied volatility skew is shaped may be beneficial, as its existence, shape, and severity can be a function of market sentiment, especially during turbulent or bearish market conditions.
But what exactly is skew? Skew is the difference between the implied volatility levels of out-of-the-money (OTM), at-the-money (ATM) and in-the-money (ITM) options. Specifically, it measures the implied volatility level for each option strike price with the same expiration month, and the resultant line drawn among these points is referred to as the "skew curve" or "volatility surface."
When mapping implied volatility levels, the curve these points create is typically identified as either a "smile" or a "smirk" depending on the shape created by the level for out-of-the-money puts and calls. The smile volatility curve exists when both the OTM puts and OTM calls are elevated relative to the ATM implied volatility level. In contrast, the smirk volatility curve shows the disparity between demand for OTM puts and OTM calls, where one side of the distribution exhibits elevated implied volatility levels relative to the rest of the implied volatility curve.
To illustrate these two concepts, let's start with the hypothetical "flat" skew, where all strikes have the same implied volatility. The "flat" skew suggests that forecasted implied volatility levels of options will have little to no difference regardless of direction or severity of movement in the underlying.
 |
 |
Smile Skew
A smile volatility skew generally exists in options when perceived underlying price movement in either direction is forecasted to increase the at-the-money implied volatility level.
 |
 |
Smirk Skew
In contrast to both flat skew and smile skew, a smirk skew curve is steeper for one side of the price distribution than the other. In this example, pricing convention is forecasting a larger impact on implied volatility levels with a downside underlying move than an upside underlying move.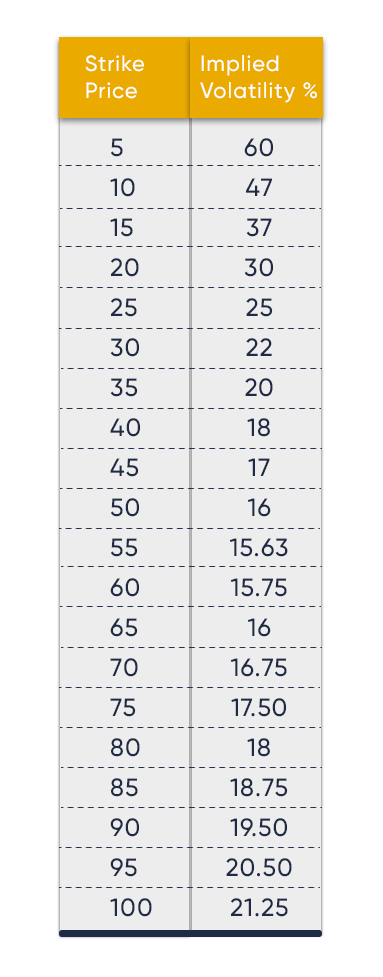 |
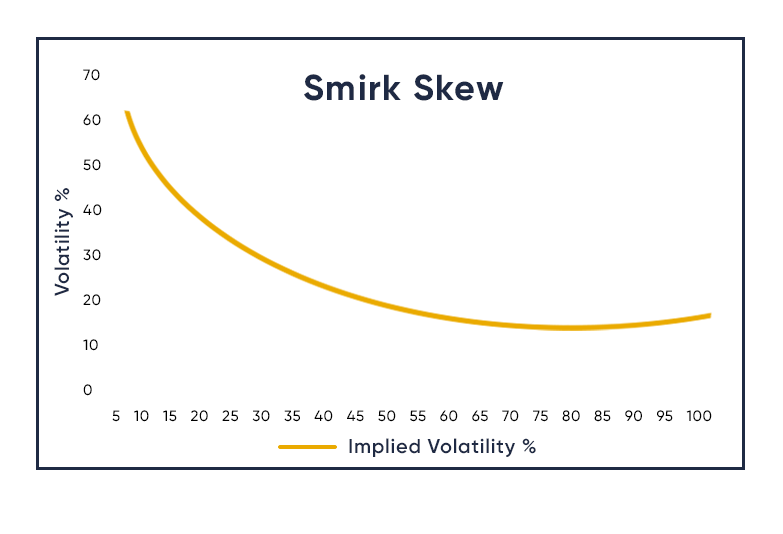 |
A smirk skew curve can be the result of investors protecting their portfolios against a declining market, which traditionally exhibits larger and more severe moves to the downside.
But by what means does skew exist? At a fundamental level, volatility skew is a product of the forces of supply and demand, and the skew curve develops naturally, as buyers meet sellers at certain prices in the marketplace.
Skew Strategies
Skew can play a major role in selecting option trading strategies. For example, consider the investor who is concerned about holding a long stock position and is looking for a way to hedge that position using options. This hypothetical investor might contemplate buying a collar by purchasing an out-of-the-money put for downside protection, in case the price of the security drops, while selling an out-of-the-money call which could benefit the investor and potentially offset the cost of buying the put.Using options in this way may control downside losses and simultaneously limit upside potential. However, doing so in a "smirk" skew environment would imply that the collar investor would likely be purchasing an option with a higher implied volatility level than the option they are selling.
On the other hand, the risk reversal strategy, which consists of simultaneously purchasing an OTM call option and selling an OTM put option with the same expiration, takes advantage of smirk skew by purchasing the lower volatility call and selling the higher volatility put.
The axiom that put options are always more expensive than call options is only true when comparing OTM puts with OTM calls in a "smirk" skew environment. Keep in mind that skew is a function of supply and demand, and can be quite dynamic - meaning these pricing conventions are often subject to change based on market conditions and expectations.
To summarize, skew is a longstanding feature of options, and it can vary depending on the asset class and other factors impacting the underlying markets. For investors, having a basic understanding of how implied volatility skew is shaped may be beneficial, as its existence, shape, and severity can be a function of market sentiment, especially during turbulent or bearish market conditions.

